


Passaic County, New Jersey
About
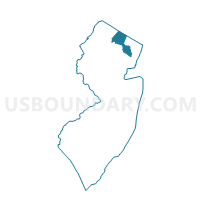
Outline

Summary
| Unique Area Identifier | 119355 |
| Name | Passaic County |
| State | New Jersey |
| Area (square miles) | 197.11 |
| Land Area (square miles) | 184.59 |
| Water Area (square miles) | 12.51 |
| % of Land Area | 93.65 |
| % of Water Area | 6.35 |
| Latitude of the Internal Point | 41.03376340 |
| Longtitude of the Internal Point | -74.30030750 |
| Total Population | 501,226 |
| Total Housing Units | 175,966 |
| Total Households | 166,785 |
| Median Age | 36.1 |
Maps
Graphs
Select a template below for downloading or customizing gragh for Passaic County, New Jersey


Neighbors
Neighoring County (by Name) Neighboring County on the Map
- Bergen County, NJ
- Essex County, NJ
- Morris County, NJ
- Orange County, NY
- Rockland County, NY
- Sussex County, NJ
County Subdivision in Passaic County (by Name) Neighboring County Subdivision on the Map
- Bloomingdale borough, Passaic County, NJ
- Clifton city, Passaic County, NJ
- Haledon borough, Passaic County, NJ
- Hawthorne borough, Passaic County, NJ
- Little Falls township, Passaic County, NJ
- North Haledon borough, Passaic County, NJ
- Passaic city, Passaic County, NJ
- Paterson city, Passaic County, NJ
- Pompton Lakes borough, Passaic County, NJ
- Prospect Park borough, Passaic County, NJ
- Ringwood borough, Passaic County, NJ
- Totowa borough, Passaic County, NJ
- Wanaque borough, Passaic County, NJ
- Wayne township, Passaic County, NJ
- West Milford township, Passaic County, NJ
- Woodland Park borough, Passaic County, NJ
Top 10 Neighboring Place (by Population) Neighboring Place on the Map
- Paterson city, NJ (146,199)
- Clifton city, NJ (84,136)
- Passaic city, NJ (69,781)
- Fair Lawn borough, NJ (32,457)
- Garfield city, NJ (30,487)
- Ridgewood village, NJ (24,958)
- Elmwood Park borough, NJ (19,403)
- Hawthorne borough, NJ (18,791)
- Rutherford borough, NJ (18,061)
- Oakland borough, NJ (12,754)
Top 10 Neighboring Elementary School District (by Population) Neighboring Elementary School District on the Map
- Rockaway Township School District, NJ (24,156)
- Wyckoff Township School District, NJ (16,696)
- Little Falls Township School District, NJ (14,432)
- Oakland Borough School District, NJ (12,754)
- Ringwood Borough School District, NJ (12,228)
- Woodland Park Borough School District, NJ (11,819)
- Wanaque Borough School District, NJ (11,116)
- Totowa Borough School District, NJ (10,804)
- Franklin Lakes Borough School District, NJ (10,590)
- Lincoln Park Borough School District, NJ (10,521)
Top 10 Neighboring Secondary School District (by Population) Neighboring Secondary School District on the Map
- Morris Hills Regional School District, NJ (53,751)
- Ramapo-Indian Hill Regional School District, NJ (40,040)
- Passaic Valley Regional School District, NJ (37,055)
- Lakeland Regional School District, NJ (23,344)
- Passaic County Manchester Regional School District, NJ (22,600)
- West Essex Regional School District, NJ (21,581)
- Wallkill Valley Regional School District, NJ (18,945)
- Carlstadt-East Rutherford School District, NJ (15,040)
Top 10 Neighboring Unified School District (by Population) Neighboring Unified School District on the Map
- Paterson City School District, NJ (146,199)
- Clifton City School District, NJ (84,136)
- Passaic City School District, NJ (69,781)
- Wayne Township School District, NJ (54,717)
- Bloomfield Township School District, NJ (47,315)
- Montclair Town School District, NJ (37,669)
- Fair Lawn Borough School District, NJ (32,457)
- Garfield City School District, NJ (30,487)
- Ramapo Central School District, NY (28,617)
- Nutley Town School District, NJ (28,370)
Top 10 Neighboring State Legislative District Lower Chamber (by Population) Neighboring State Legislative District Lower Chamber on the Map
- General Assembly District 38, NJ (222,394)
- General Assembly District 36, NJ (219,354)
- General Assembly District 26, NJ (217,839)
- General Assembly District 40, NJ (216,232)
- General Assembly District 25, NJ (215,844)
- General Assembly District 24, NJ (215,703)
- General Assembly District 28, NJ (210,635)
- General Assembly District 35, NJ (209,995)
- General Assembly District 34, NJ (205,421)
- General Assembly District 27, NJ (204,496)
Top 10 Neighboring State Legislative District Upper Chamber (by Population) Neighboring State Legislative District Upper Chamber on the Map
- State Senate District 38, NY (347,376)
- State Senate District 38, NJ (222,394)
- State Senate District 36, NJ (219,354)
- State Senate District 26, NJ (217,839)
- State Senate District 40, NJ (216,232)
- State Senate District 25, NJ (215,844)
- State Senate District 24, NJ (215,703)
- State Senate District 28, NJ (210,635)
- State Senate District 35, NJ (209,995)
- State Senate District 34, NJ (205,421)
Top 10 Neighboring 111th Congressional District (by Population) Neighboring 111th Congressional District on the Map
- Congressional District 19, NY (699,959)
- Congressional District 17, NY (678,558)
- Congressional District 11, NJ (674,349)
- Congressional District 5, NJ (666,551)
- Congressional District 9, NJ (661,379)
- Congressional District 8, NJ (660,424)
Top 10 Census Tract in Passaic County (by Population) Neighboring Census Tract on the Map
- Census Tract 1635, Passaic County, NJ (8,417)
- Census Tract 1540.01, Passaic County, NJ (7,792)
- Census Tract 1165, Passaic County, NJ (7,656)
- Census Tract 1242, Passaic County, NJ (7,591)
- Census Tract 2238.02, Passaic County, NJ (7,547)
- Census Tract 1801, Passaic County, NJ (7,540)
- Census Tract 1825, Passaic County, NJ (7,498)
- Census Tract 1830, Passaic County, NJ (7,452)
- Census Tract 1755, Passaic County, NJ (7,439)
- Census Tract 1758.02, Passaic County, NJ (7,410)
Top 10 Neighboring 5-Digit ZIP Code Tabulation Area (by Population) Neighboring 5-Digit ZIP Code Tabulation Area on the Map
- 07055, NJ (69,816)
- 07470, NJ (54,717)
- 07003, NJ (47,312)
- 07011, NJ (39,710)
- 07501, NJ (33,543)
- 07410, NJ (32,457)
- 07026, NJ (30,555)
- 07110, NJ (28,351)
- 07013, NJ (27,051)
- 07424, NJ (26,222)
Data
Demographic, Population, Households, and Housing Units
** Data sources from census 2010 **
Show Data on Map
Download Full List as CSV
Download Quick Sheet as CSV
| Subject | This Area | New Jersey | National |
|---|---|---|---|
| POPULATION | |||
| Total Population Map | 501,226 | 8,791,894 | 308,745,538 |
| POPULATION, HISPANIC OR LATINO ORIGIN | |||
| Not Hispanic or Latino Map | 315,549 | 7,236,750 | 258,267,944 |
| Hispanic or Latino Map | 185,677 | 1,555,144 | 50,477,594 |
| POPULATION, RACE | |||
| White alone Map | 314,001 | 6,029,248 | 223,553,265 |
| Black or African American alone Map | 64,295 | 1,204,826 | 38,929,319 |
| American Indian and Alaska Native alone Map | 3,348 | 29,026 | 2,932,248 |
| Asian alone Map | 25,092 | 725,726 | 14,674,252 |
| Native Hawaiian and Other Pacific Islander alone Map | 156 | 3,043 | 540,013 |
| Some Other Race alone Map | 75,735 | 559,722 | 19,107,368 |
| Two or More Races Map | 18,599 | 240,303 | 9,009,073 |
| POPULATION, SEX | |||
| Male Map | 243,124 | 4,279,600 | 151,781,326 |
| Female Map | 258,102 | 4,512,294 | 156,964,212 |
| POPULATION, AGE (18 YEARS) | |||
| 18 years and over Map | 376,613 | 6,726,680 | 234,564,071 |
| Under 18 years | 124,613 | 2,065,214 | 74,181,467 |
| POPULATION, AGE | |||
| Under 5 years | 34,247 | 541,020 | 20,201,362 |
| 5 to 9 years | 34,008 | 564,750 | 20,348,657 |
| 10 to 14 years | 34,536 | 587,335 | 20,677,194 |
| 15 to 17 years | 21,822 | 372,109 | 12,954,254 |
| 18 and 19 years | 15,782 | 225,990 | 9,086,089 |
| 20 years | 8,013 | 108,760 | 4,519,129 |
| 21 years | 7,398 | 106,219 | 4,354,294 |
| 22 to 24 years | 20,614 | 326,259 | 12,712,576 |
| 25 to 29 years | 33,501 | 553,139 | 21,101,849 |
| 30 to 34 years | 33,173 | 556,662 | 19,962,099 |
| 35 to 39 years | 33,499 | 588,379 | 20,179,642 |
| 40 to 44 years | 35,615 | 649,918 | 20,890,964 |
| 45 to 49 years | 37,411 | 704,516 | 22,708,591 |
| 50 to 54 years | 35,704 | 674,680 | 22,298,125 |
| 55 to 59 years | 30,182 | 565,623 | 19,664,805 |
| 60 and 61 years | 10,719 | 201,084 | 7,113,727 |
| 62 to 64 years | 14,678 | 279,458 | 9,704,197 |
| 65 and 66 years | 7,800 | 149,028 | 5,319,902 |
| 67 to 69 years | 10,426 | 201,944 | 7,115,361 |
| 70 to 74 years | 13,624 | 260,462 | 9,278,166 |
| 75 to 79 years | 10,679 | 215,715 | 7,317,795 |
| 80 to 84 years | 8,784 | 179,233 | 5,743,327 |
| 85 years and over | 9,011 | 179,611 | 5,493,433 |
| MEDIAN AGE BY SEX | |||
| Both sexes Map | 36.10 | 39.00 | 37.20 |
| Male Map | 34.70 | 37.40 | 35.80 |
| Female Map | 37.60 | 40.30 | 38.50 |
| HOUSEHOLDS | |||
| Total Households Map | 166,785 | 3,214,360 | 116,716,292 |
| HOUSEHOLDS, HOUSEHOLD TYPE | |||
| Family households: Map | 120,840 | 2,226,606 | 77,538,296 |
| Husband-wife family Map | 81,287 | 1,643,377 | 56,510,377 |
| Other family: Map | 39,553 | 583,229 | 21,027,919 |
| Male householder, no wife present Map | 10,345 | 154,134 | 5,777,570 |
| Female householder, no husband present Map | 29,208 | 429,095 | 15,250,349 |
| Nonfamily households: Map | 45,945 | 987,754 | 39,177,996 |
| Householder living alone Map | 37,706 | 811,221 | 31,204,909 |
| Householder not living alone Map | 8,239 | 176,533 | 7,973,087 |
| HOUSEHOLDS, HISPANIC OR LATINO ORIGIN OF HOUSEHOLDER | |||
| Not Hispanic or Latino householder: Map | 117,485 | 2,777,617 | 103,254,926 |
| Hispanic or Latino householder: Map | 49,300 | 436,743 | 13,461,366 |
| HOUSEHOLDS, RACE OF HOUSEHOLDER | |||
| Householder who is White alone | 112,960 | 2,340,060 | 89,754,352 |
| Householder who is Black or African American alone | 21,443 | 428,304 | 14,129,983 |
| Householder who is American Indian and Alaska Native alone | 901 | 8,686 | 939,707 |
| Householder who is Asian alone | 6,861 | 223,319 | 4,632,164 |
| Householder who is Native Hawaiian and Other Pacific Islander alone | 46 | 925 | 143,932 |
| Householder who is Some Other Race alone | 19,500 | 152,495 | 4,916,427 |
| Householder who is Two or More Races | 5,074 | 60,571 | 2,199,727 |
| HOUSEHOLDS, HOUSEHOLD TYPE BY HOUSEHOLD SIZE | |||
| Family households: Map | 120,840 | 2,226,606 | 77,538,296 |
| 2-person household Map | 37,817 | 812,884 | 31,882,616 |
| 3-person household Map | 28,472 | 539,679 | 17,765,829 |
| 4-person household Map | 26,916 | 498,316 | 15,214,075 |
| 5-person household Map | 14,559 | 228,492 | 7,411,997 |
| 6-person household Map | 6,777 | 86,142 | 3,026,278 |
| 7-or-more-person household Map | 6,299 | 61,093 | 2,237,501 |
| Nonfamily households: Map | 45,945 | 987,754 | 39,177,996 |
| 1-person household Map | 37,706 | 811,221 | 31,204,909 |
| 2-person household Map | 6,616 | 144,798 | 6,360,012 |
| 3-person household Map | 885 | 18,350 | 992,156 |
| 4-person household Map | 448 | 7,791 | 411,171 |
| 5-person household Map | 199 | 3,235 | 126,634 |
| 6-person household Map | 49 | 1,302 | 48,421 |
| 7-or-more-person household Map | 42 | 1,057 | 34,693 |
| HOUSING UNITS | |||
| Total Housing Units Map | 175,966 | 3,553,562 | 131,704,730 |
| HOUSING UNITS, OCCUPANCY STATUS | |||
| Occupied Map | 166,785 | 3,214,360 | 116,716,292 |
| Vacant Map | 9,181 | 339,202 | 14,988,438 |
| HOUSING UNITS, OCCUPIED, TENURE | |||
| Owned with a mortgage or a loan Map | 66,925 | 1,532,012 | 52,979,430 |
| Owned free and clear Map | 24,900 | 570,453 | 23,006,644 |
| Renter occupied Map | 74,960 | 1,111,895 | 40,730,218 |
| HOUSING UNITS, VACANT, VACANCY STATUS | |||
| For rent Map | 3,821 | 92,118 | 4,137,567 |
| Rented, not occupied Map | 171 | 4,578 | 206,825 |
| For sale only Map | 1,314 | 39,260 | 1,896,796 |
| Sold, not occupied Map | 315 | 8,145 | 421,032 |
| For seasonal, recreational, or occasional use Map | 858 | 134,903 | 4,649,298 |
| For migrant workers Map | 1 | 156 | 24,161 |
| Other vacant Map | 2,701 | 60,042 | 3,652,759 |
| HOUSING UNITS, OCCUPIED, AVERAGE HOUSEHOLD SIZE BY TENURE | |||
| Total: Map | 2.94 | 2.68 | 2.58 |
| Owner occupied Map | 2.99 | 2.79 | 2.65 |
| Renter occupied Map | 2.88 | 2.47 | 2.44 |
| HOUSING UNITS, OCCUPIED, TENURE BY RACE OF HOUSEHOLDER | |||
| Owner occupied: Map | 91,825 | 2,102,465 | 75,986,074 |
| Householder who is White alone Map | 74,264 | 1,717,602 | 63,446,275 |
| Householder who is Black or African American alone Map | 6,120 | 171,748 | 6,261,464 |
| Householder who is American Indian and Alaska Native alone Map | 299 | 3,523 | 509,588 |
| Householder who is Asian alone Map | 4,321 | 137,287 | 2,688,861 |
| Householder who is Native Hawaiian and Other Pacific Islander alone Map | 14 | 375 | 61,911 |
| Householder who is Some Other Race alone Map | 5,069 | 45,382 | 1,975,817 |
| Householder who is Two or More Races Map | 1,738 | 26,548 | 1,042,158 |
| Renter occupied: Map | 74,960 | 1,111,895 | 40,730,218 |
| Householder who is White alone Map | 38,696 | 622,458 | 26,308,077 |
| Householder who is Black or African American alone Map | 15,323 | 256,556 | 7,868,519 |
| Householder who is American Indian and Alaska Native alone Map | 602 | 5,163 | 430,119 |
| Householder who is Asian alone Map | 2,540 | 86,032 | 1,943,303 |
| Householder who is Native Hawaiian and Other Pacific Islander alone Map | 32 | 550 | 82,021 |
| Householder who is Some Other Race alone Map | 14,431 | 107,113 | 2,940,610 |
| Householder who is Two or More Races Map | 3,336 | 34,023 | 1,157,569 |
| HOUSING UNITS, OCCUPIED, TENURE BY HISPANIC OR LATINO ORIGIN OF HOUSEHOLDER | |||
| Owner occupied: Map | 91,825 | 2,102,465 | 75,986,074 |
| Not Hispanic or Latino householder Map | 76,772 | 1,943,837 | 69,617,625 |
| Hispanic or Latino householder Map | 15,053 | 158,628 | 6,368,449 |
| Renter occupied: Map | 74,960 | 1,111,895 | 40,730,218 |
| Not Hispanic or Latino householder Map | 40,713 | 833,780 | 33,637,301 |
| Hispanic or Latino householder Map | 34,247 | 278,115 | 7,092,917 |
| HOUSING UNITS, OCCUPIED, TENURE BY HOUSEHOLD SIZE | |||
| Owner occupied: Map | 91,825 | 2,102,465 | 75,986,074 |
| 1-person household Map | 16,718 | 418,027 | 16,453,569 |
| 2-person household Map | 27,301 | 671,621 | 27,618,605 |
| 3-person household Map | 16,462 | 378,218 | 12,517,563 |
| 4-person household Map | 16,531 | 373,606 | 10,998,793 |
| 5-person household Map | 8,129 | 166,068 | 5,057,765 |
| 6-person household Map | 3,555 | 58,752 | 1,965,796 |
| 7-or-more-person household Map | 3,129 | 36,173 | 1,373,983 |
| Renter occupied: Map | 74,960 | 1,111,895 | 40,730,218 |
| 1-person household Map | 20,988 | 393,194 | 14,751,340 |
| 2-person household Map | 17,132 | 286,061 | 10,624,023 |
| 3-person household Map | 12,895 | 179,811 | 6,240,422 |
| 4-person household Map | 10,833 | 132,501 | 4,626,453 |
| 5-person household Map | 6,629 | 65,659 | 2,480,866 |
| 6-person household Map | 3,271 | 28,692 | 1,108,903 |
| 7-or-more-person household Map | 3,212 | 25,977 | 898,211 |
Loading...